Nagios can be easily set up to handle graphing of mySQL database performance metrics. The set of indicators will be graphed by pnp4nagios, a performance data analyzer and grapher for Nagios.
After enabling graphing you will be able to observe trends over hour/day/week/month/year, identify degradation of your DB performance and with little tuning even issue alerts based on thresholds. The DB we're setting up monitoring for in this example is a mySQL DB used by DRUPAL, a popular CMS.
Metrics
Some of the mySQL performance indicators provided by this set of plugins are:
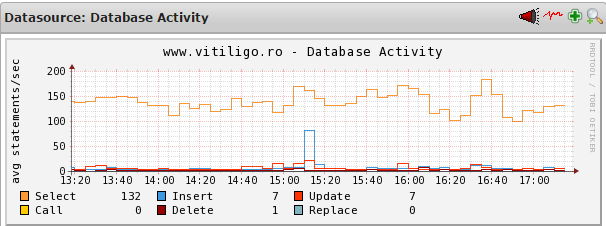
- database activity (selects/insert/delete/update..)
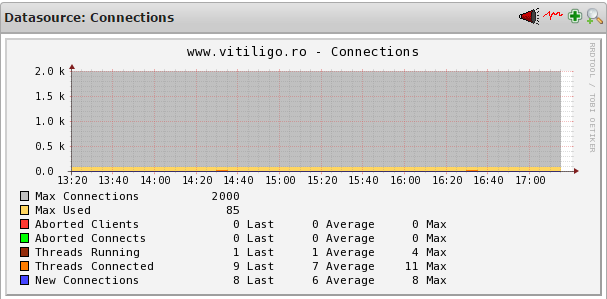
- connections (how many of the max connections are used, number of threads running/connected)
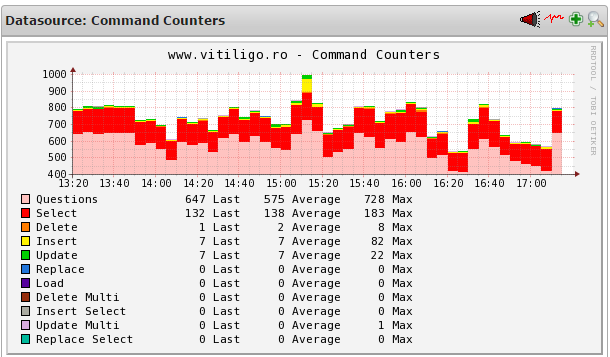
- command counters
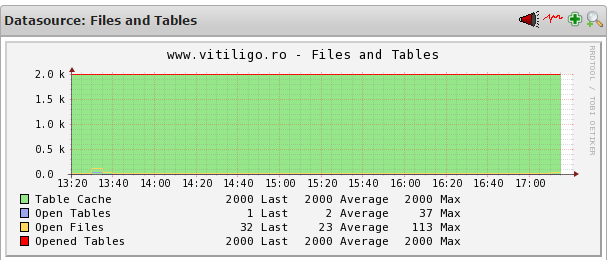
- files and tables
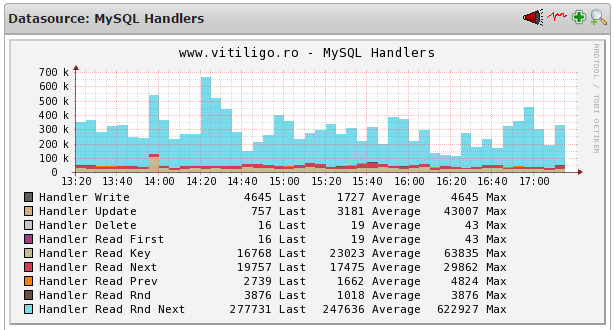
- mySQL Handlers
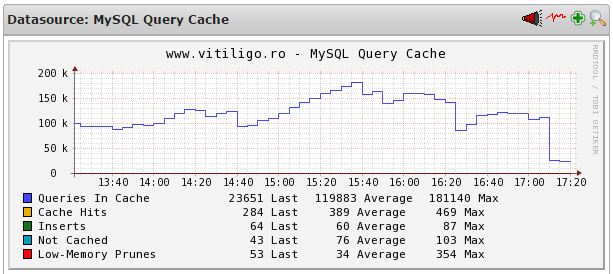
- mySQL Query Cache
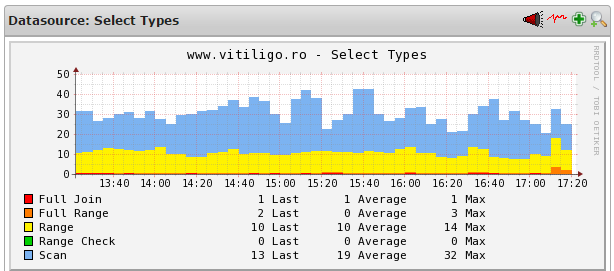
- Select Types
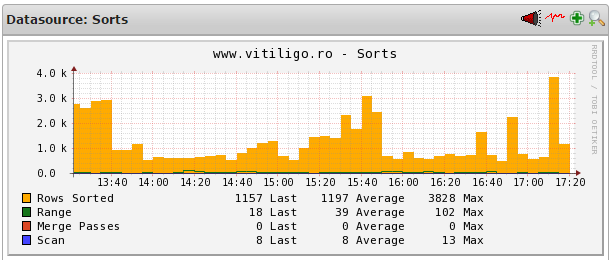
- Sorts
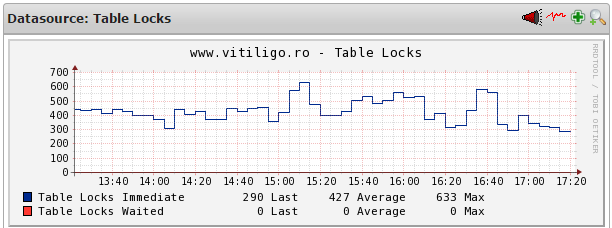
- Table Locks
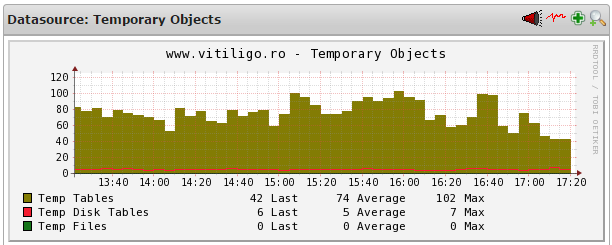
- Temporary Objects
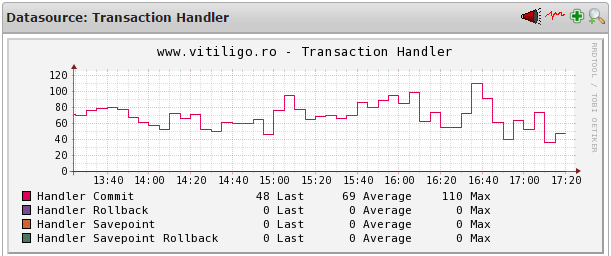
- Transaction Handler
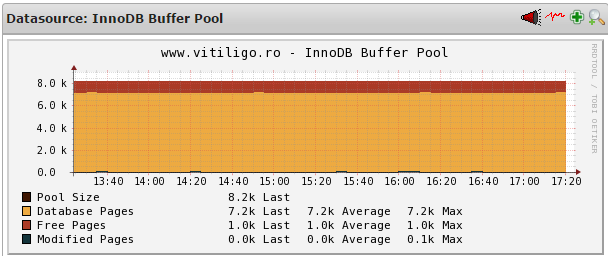
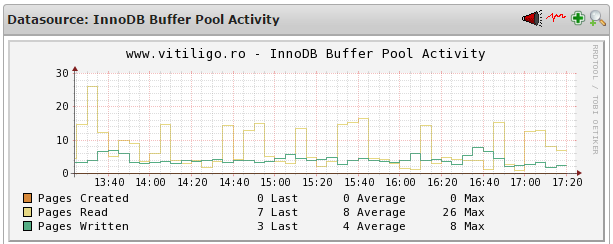
- InnoDB Buffer Pool
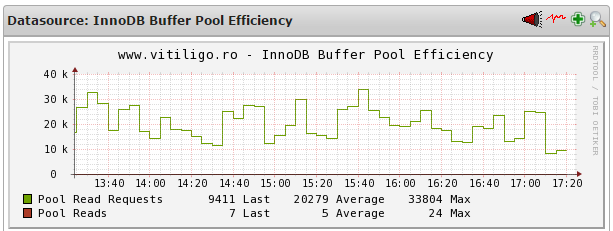
- InnoDB Buffer Efficiency
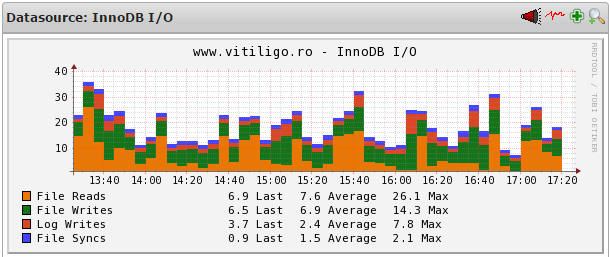
- InnoDB I/O (File Reads/Writes)
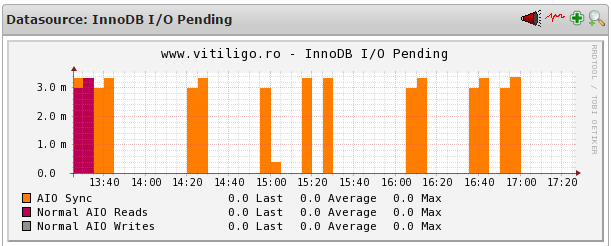
- InnoDB I/O Pending
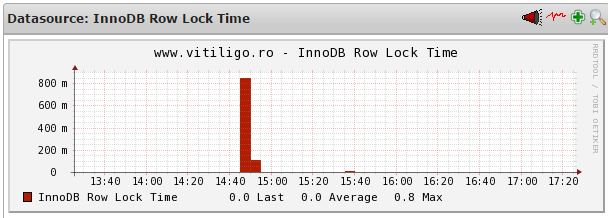
- InnoDB Row Lock Time
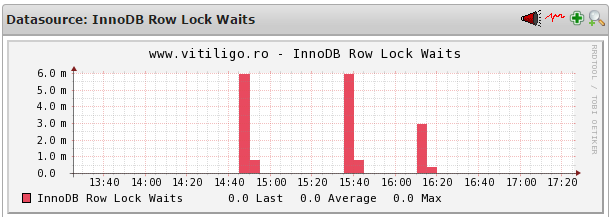
- InnoDB Row Lock Waits
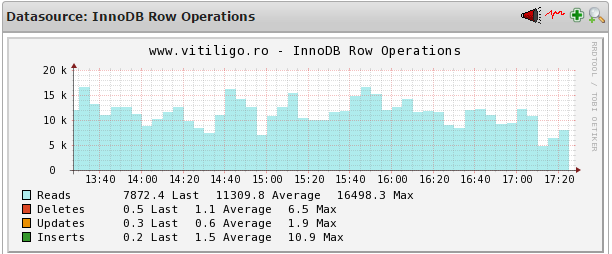
- InnoDB Row Operations
Shopping list
- Nagios installation;
- PHP4Nagios for graphing;
- check_mysql_counters - nagios plugin and set of templates for pnp4nagios created by Jason Holtzapple;
- mysql DB v5.6;
- Access to your DB, if you want to create a dedicated user to be used for retrieving the stats;
Howto
1) Connect to your mySQL database and create a database user that will be used for monitoring
CREATE USER 'nagios_user'@'localhost' IDENTIFIED BY 'nagios_pass'; GRANT SELECT ON database.* TO 'nagios_user'@'localhost'; 2) Copy the check_mysql_counters_56 plugin to your libexec folder
/usr/local/nagios/libexec/check_mysql_counters_563) copy the pnp4nagios template corresponding to your DB system to the pnp4nagios template folder. Make sure the name of the template file is identical to the name of your check command (eg. check_dbstats) /usr/local/pnp4nagios/share/templates/check_dbstats.php
4) Check if the check_mysql_counters_56 script is able to retrieve the parameters needed for graphing. Note the user, pass and port have been replaced.
[nagios@vps52974 libexec]$ ./check_mysql_counters_56 -H www.vitiligo.ro -P 1000 -u nagios_user -p nagios_pass

MYSQL_COUNTERS OK | 'ABORTED_CLIENTS'=20471c 'ABORTED_CONNECTS'=16885c 'BINLOG_CACHE_DISK_USE'=0c 'BINLOG_CACHE_USE'=0c 'BINLOG_STMT_CACHE_DISK_USE'=0c 'BINLOG_STMT_CACHE_USE'=0c 'BYTES_RECEIVED'=1202006509628B 'BYTES_SENT'=2065543760856B 'COM_ADMIN_COMMANDS'=178538c 'COM_ASSIGN_TO_KEYCACHE'=0c 'COM_ALTER_DB'=6c 'COM_ALTER_DB_UPGRADE'=0c 'COM_ALTER_EVENT'=0c 'COM_ALTER_FUNCTION'=0c 'COM_ALTER_PROCEDURE'=0c 'COM_ALTER_SERVER'=0c 'COM_ALTER_TABLE'=2105c 'COM_ALTER_TABLESPACE'=0c 'COM_ANALYZE'=0c 'COM_BEGIN'=22868c 'COM_BINLOG'=0c 'COM_CALL_PROCEDURE'=2c ' [...]
5) Create the Nagios host, service and command definitions. Note the user, pass and port have been replaced.
define host{
use linux-server,host-pnp
host_name www.vitiligo.ro
alias www.vitiligo.ro
address www.vitiligo.ro
}

define service{
use local-service, srv-pnp
host_name www.vitiligo.ro
service_description MYSQL_COUNTERS
check_command check_dbstats!1000!nagios_user!nagios_pass!
}

define command{
command_name check_dbstats
command_line $USER1$/check_mysql_counters_56 -H $HOSTADDRESS$ -P $ARG1$ -u $ARG2$ -p $ARG3$
}
Results
Performance graphs plotted by PHP4Nagios