Monitor mySQL DB performance with Nagios
Nagios can be easily set up to handle graphing of mySQL database performance metrics. The set of indicators will be graphed by pnp4nagios, a performance data analyzer and grapher for Nagios.
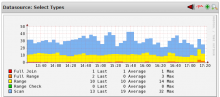
After enabling graphing you will be able to observe trends over hour/day/week/month/year, identify degradation of your DB performance and with little tuning even issue alerts based on thresholds. The DB we're setting up monitoring for in this example is a mySQL DB used by DRUPAL, a popular CMS.