Is Your Brand Being Targeted?
Search millions of newly registered domains and instantly discover who is impersonating your brand.
Choose the Alerting Destination you need
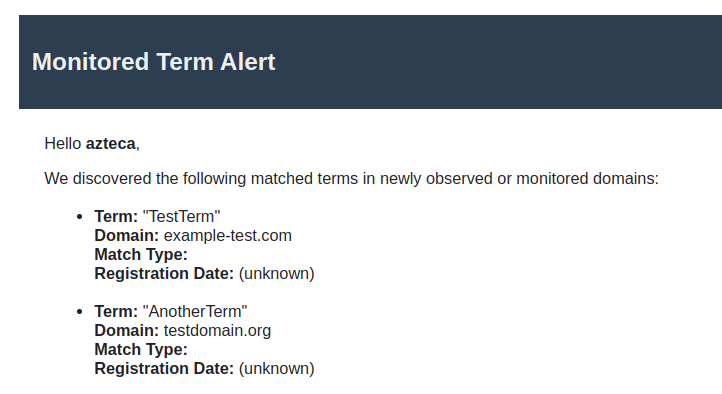
Receive detailed alerts the moment a matching domain is registered - no polling, no delays. Each notification includes domain name, registration date, WHOIS, DNS records, and a live screenshot.
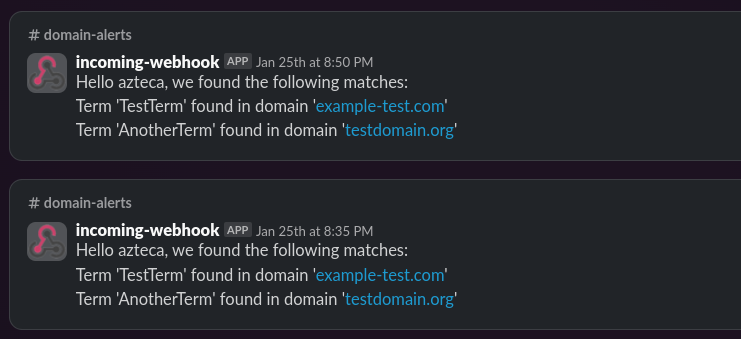
Configure a webhook in minutes. Each message surfaces the domain, match details, and a direct link to the full report - triage and escalate without leaving Slack.
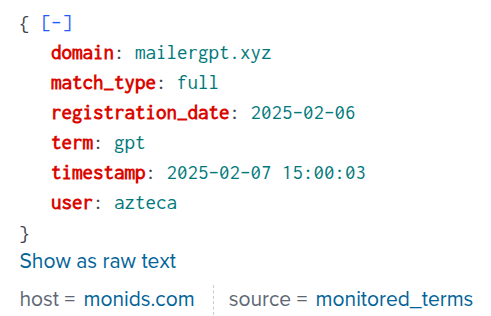
Push every domain event into Splunk via HEC for centralized logging, custom dashboards, and correlation with your existing security telemetry.
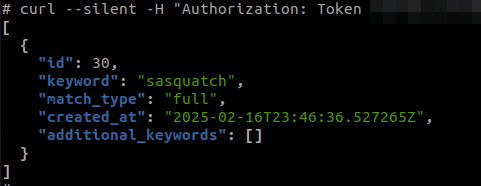
Manage alerts, retrieve events, and update preferences via RESTful API - authenticated with a personal token. Stream events directly into your SIEM, SOAR, or custom tooling.
How does it work?
-
Monitor & Detect
Our system continuously scans the global domain landscape-across all major generic TLDs, new gTLDs, and a multitude of country code TLDs-to identify any new registrations containing your brand, targeted keywords, or even subtle, deceptive variations. By using advanced matching algorithms (full and fuzzy), nothing slips through the cracks.
-
Instant Alerting & Detailed Analysis
When a suspicious domain is detected, you’re immediately notified via email, Slack, or Splunk alerts. Our system not only flags potential threats but also provides in-depth analysis-highlighting exact matches, near-miss variations, and even keywords embedded within website content-ensuring you have all the information you need at your fingertips.
-
Take Action & Protect Your Brand
With every alert recorded on an intuitive dashboard, you can quickly review and verify suspicious domains. Then, leverage our full-service takedown and blacklisting capabilities to neutralize threats-so you can safeguard your brand’s reputation and maintain complete control over your digital identity.
Set up your own alerts! Register
Search Types
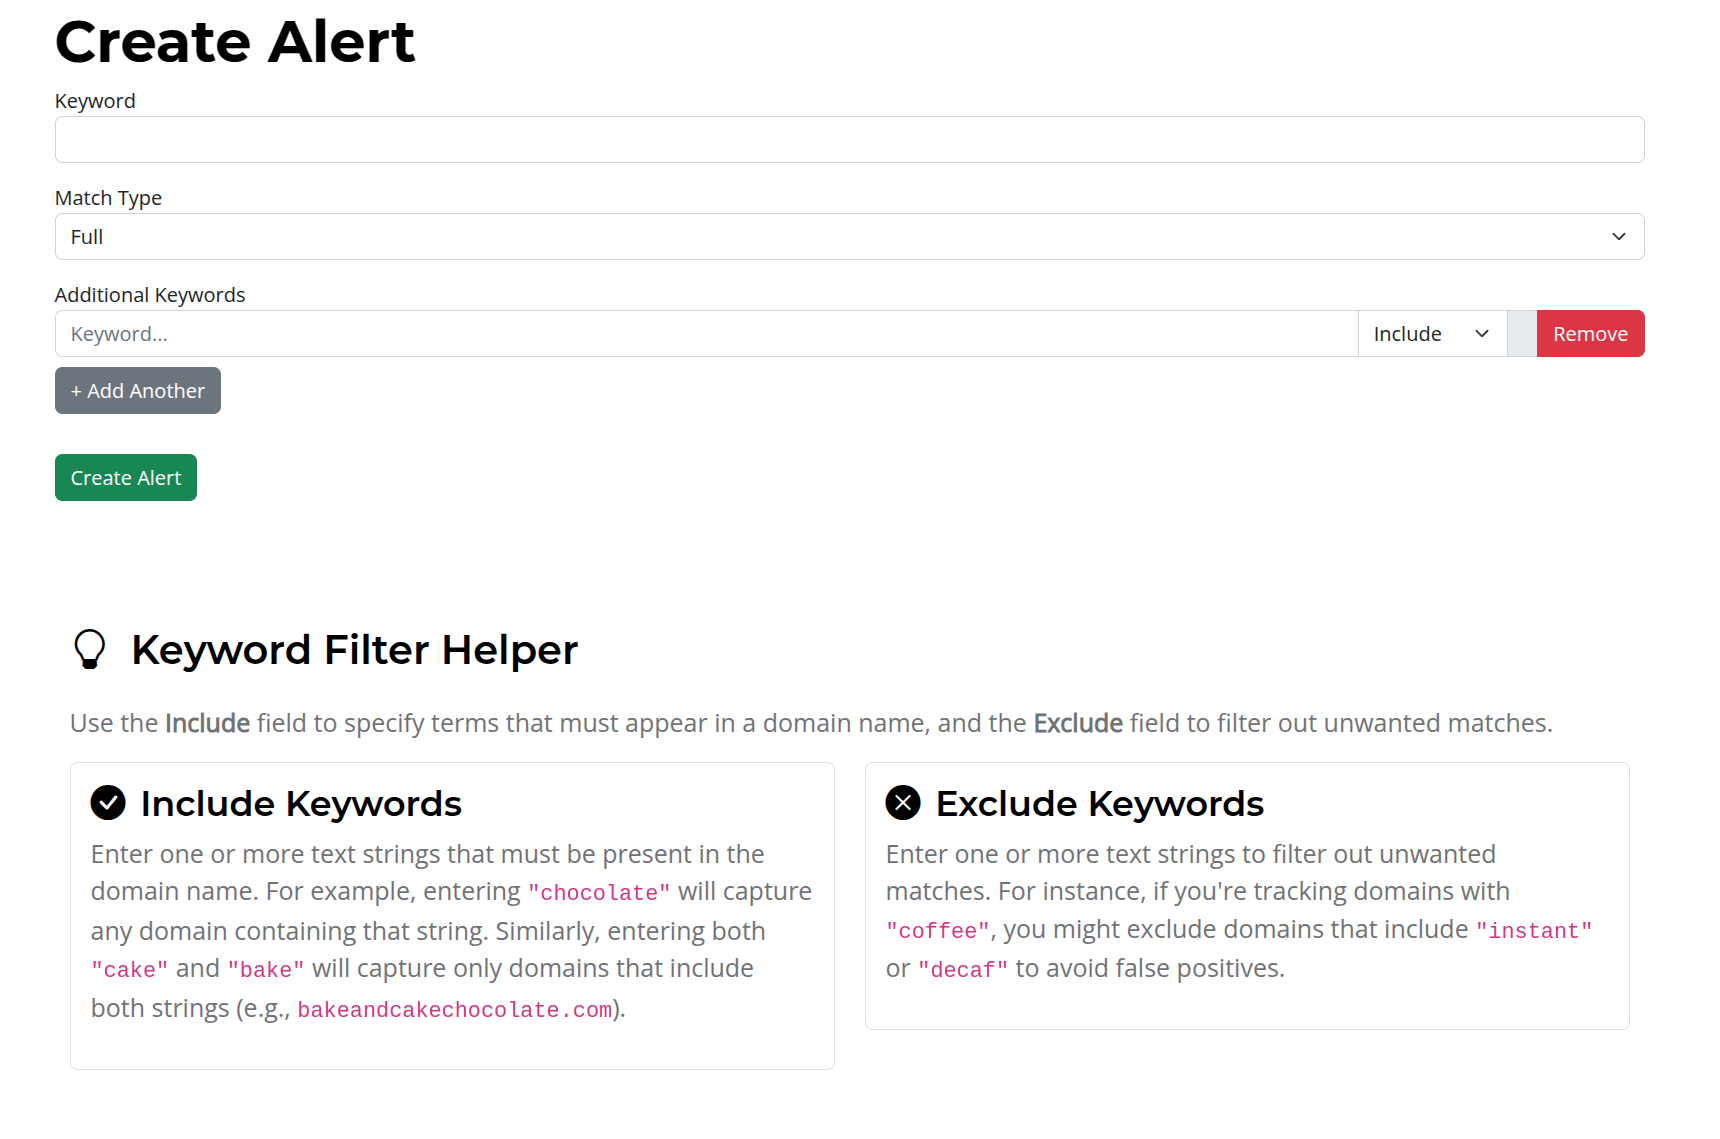
Full Match with Keywords & Exclusions
Fine-tune your alerts by combining an exact match with additional criteria. Include secondary keywords for context or exclude certain terms to reduce noise and focus on the registrations that truly matter.

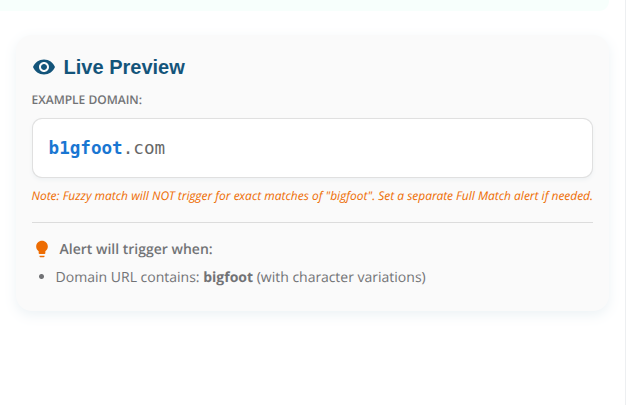
Fuzzy Match for Deceptive Variations
Detect subtle misspellings and character substitutions that threat actors use to imitate your brand. For example, if you monitor the common word "book" and someone registers "b00k.net," our fuzzy matching system will flag this near-identical variation for further review.
On-Page Keyword Detection
Extend your monitoring beyond the domain name. Our system scans the content of newly registered websites for your defined keywords, alerting you when your target term appears in the page content—so you never miss potential infringement.

Take action!

From the Blog

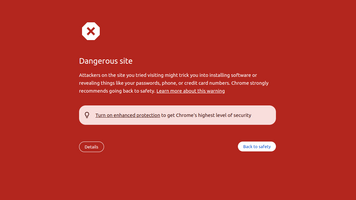
How Attackers Use Lookalike Domains Against You
Every phishing campaign starts with a domain registration. Learn how attackers move from registration to active attack, why detection usually happens too late, and how to catch lookalike domains before they're weaponized.
Read Article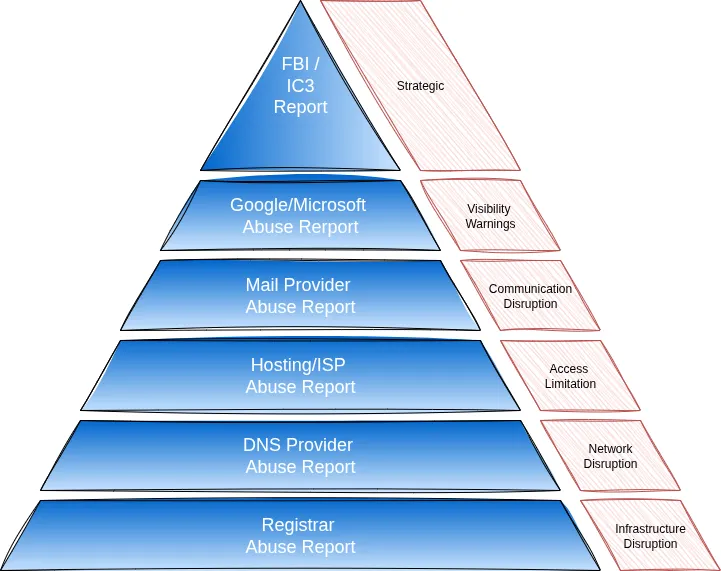
Domain Impersonation Takedowns: What Works and What Doesn't
A practical guide to shutting down impersonating domains. Learn the most effective methods, from registrar takedowns to security provider reports, and how to respond fast when your brand is targeted.
Read Article
Detecting Brand Impersonation in 2025
Brand impersonation fueled over half of cybercrime losses in 2020, costing nearly $2 billion in the US. Learn how attackers twist domain names to fool users and how to spot them.
Read ArticleFrequently Asked Questions